Demographics 25-Mile Statistics
Population
513,871
Employees
220,257
Businesses
16,556
Daytime Workers
251,181
Households
204,767
Average Household Income
$122,912
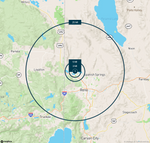
Demographics
RADIUS
1-MILE
3-MILES
5-MILES
Population
365
29,817
50,900
Households
141
9,899
17,629
Household Income
$147,577
$101,512
$102,487
Place of Work- Employees
1,101
4,283
7,168
RADIUS
Population
Households
Household Income
Place of Work- Employees
1-MILE
667
255
$144,855
1,018
RADIUS
Population
Households
Household Income
Place of Work- Employees
3-MILE
26,334
8,722
$96,522
4,331
RADIUS
Population
Households
Household Income
Place of Work- Employees
5-MILE
49,531
17,148
$97,307
7,262
Distribution & Warehouse Skills
Reno AirLogistics Park is located in one of the nation’s most concentrated hubs for warehouse, manufacturing and distribution talent. Northern Nevada’s transportation and warehouse workforce exceeds the national average in both density and skill specialization, offering companies reliable access to trained labor.
According to the Nevada Governor’s Office of Economic Development (GOED), average annual earnings in the state’s transportation and logistics sector reached $82,144 in 2025, equivalent to approximately $39.50 per hour for a full-time worker. These wages reflect the strong demand for experienced logistics professionals in the region.
For companies pursuing state incentive programs, GOED sets a minimum average wage requirement of $18.03 per hour for logistics and operations projects, establishing a clear baseline for compensation within the sector.
Labor Cost Differential
Labor Analytics identified select transportation/ logistics and manufacturing occupations to identify market wages and compare them to the competitive west coast markets.
- While Logistics wages are higher than the national average, wages in Reno are significantly lower than in San Francisco, San Jose and Long Beach, with savings ranging from 7.9% to 19.7%.
- Similarly, wages for Manufacturing roles are slightly higher than the national average but offer an occupier significant savings over San Francisco, Sacramento, San Jose and Long Beach, with savings ranging from 5.8% to 20.5%.

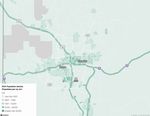
Population Density